matplotlib_vennのベン図に画像を載せる
目的
結果
ポイント
画像の追加
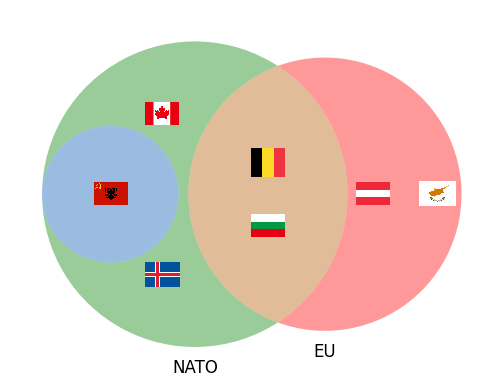
- matplotlib_vennのvenn3関数でベン図を作成し、matplotlibのOffsetImage、AnnotationBboxを作成し、AxesにArtistとして追加することで作図した
- OffsetImage、AnnotationBboxのクラス継承関係は下記の通り(画像はmatplotlibのドキュメントより)
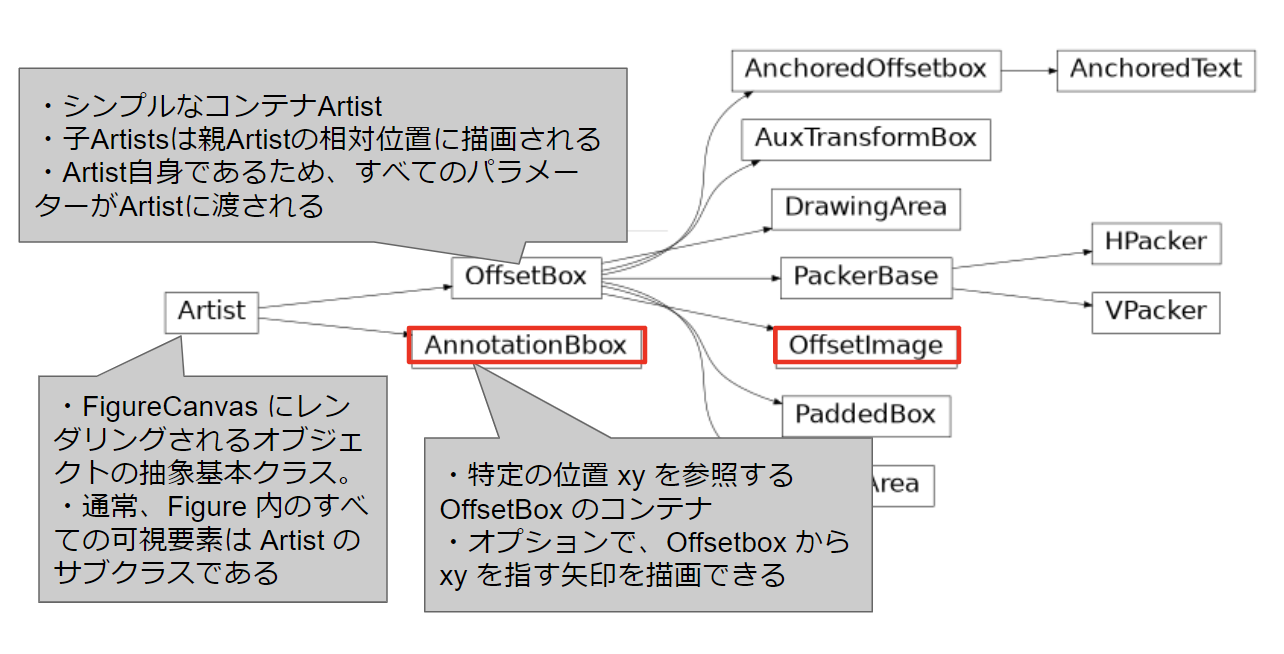
- AnnotationBboxは、特定の位置 xy を参照する OffsetBox のコンテナであるため、OffsetImageを設定することで、グラフの設定した位置に画像を描画するArtistとすることができる
- OffsetImageはImageを読み込めるOffsetBox(コンテナとなるArtist要素)
- 該当部分のコードは下記
list_dataは下記のようなデータ構造のdictionaryのリスト
{
    'x': (画像を表示するx座標),
    'y': (画像を表示するy座標),
    'image': (画像ファイルのパス),
    'zoom': (画像の拡大率)
}
def im_rend(list_data, ax=None):
    if ax is None:
        ax = plt.gca()
    artists = []
    for data in list_data:
        try:
            data["image"] = plt.imread(data["image"])
        except:
            pass
        im = OffsetImage(data["image"], zoom=data["zoom"])
        ab = AnnotationBbox(im, (data["x"], data["y"]), xycoords='data', frameon=False)
        artists.append(ax.add_artist(ab))
    return artists
画像の配置方法
- 前節のAnnotationBboxに設定するx, yの位置を調整することで画像を並べる
- ベン図のラベル位置を中心にして、描画範囲(
height、width)を指定し、その中で指定した行数(column)になるように均等に画像を並べる
- 該当部分のコードは下記(詳細説明は割愛)
def calc_pos_offset(center, div, length, mode):
    if (div > 1):
        interval = length / div
    else:
        interval = 0
    list_offset = []
    for d in range(div):
        offset = d * interval - interval / 2
        if mode == "row":
            list_offset.append(center - offset)
        elif mode == "col":
            list_offset.append(center + offset)
    return list_offset

def get_pos(cx, cy, num_elements, height, width, column):
    list_pos = []
    rows = math.ceil(num_elements / column)
    row_offset = calc_pos_offset(cy, rows, height, "row")
    for r in range(rows):
        if ((num_elements - r * column) >= column):
            n = column
        else:
            n = (num_elements - r * column)
        column_offset = calc_pos_offset(cx, n, width, "col")
        for c in range(n):
            list_pos.append({
                'x': column_offset[c],
                'y': row_offset[r],
            })
    return list_pos
ラベルの非表示化
- デフォルトではベン図上に表示されるラベルの非表示化
- 該当部分のコードは下記
vdはmatplotlibのvenn3関数の返り値
for idx, subset in enumerate(vd.subset_labels):
        try:
            vd.subset_labels[idx].set_visible(False)
        except:
            pass